[ 2D scan | 1D scan | vs. time scan | RSM | Combinations || main help index ]
WinSPA offers four basic scan modes, three of which were already implemented in the previous Spa4.1d software: One and two-dimensional scans in the reciprocal space and intensity logging of diffraction spots versus time. In addition, there is a new scan mode, called reciprocal space map (RSM), which allows to identify surface facet orientations and mosaic structures. This scan mode had to be implemented in Spa4.1d and earlier software by manually combining 1D line scans.
[ scan settings | scan action | tools | scaling | file | context menu ]
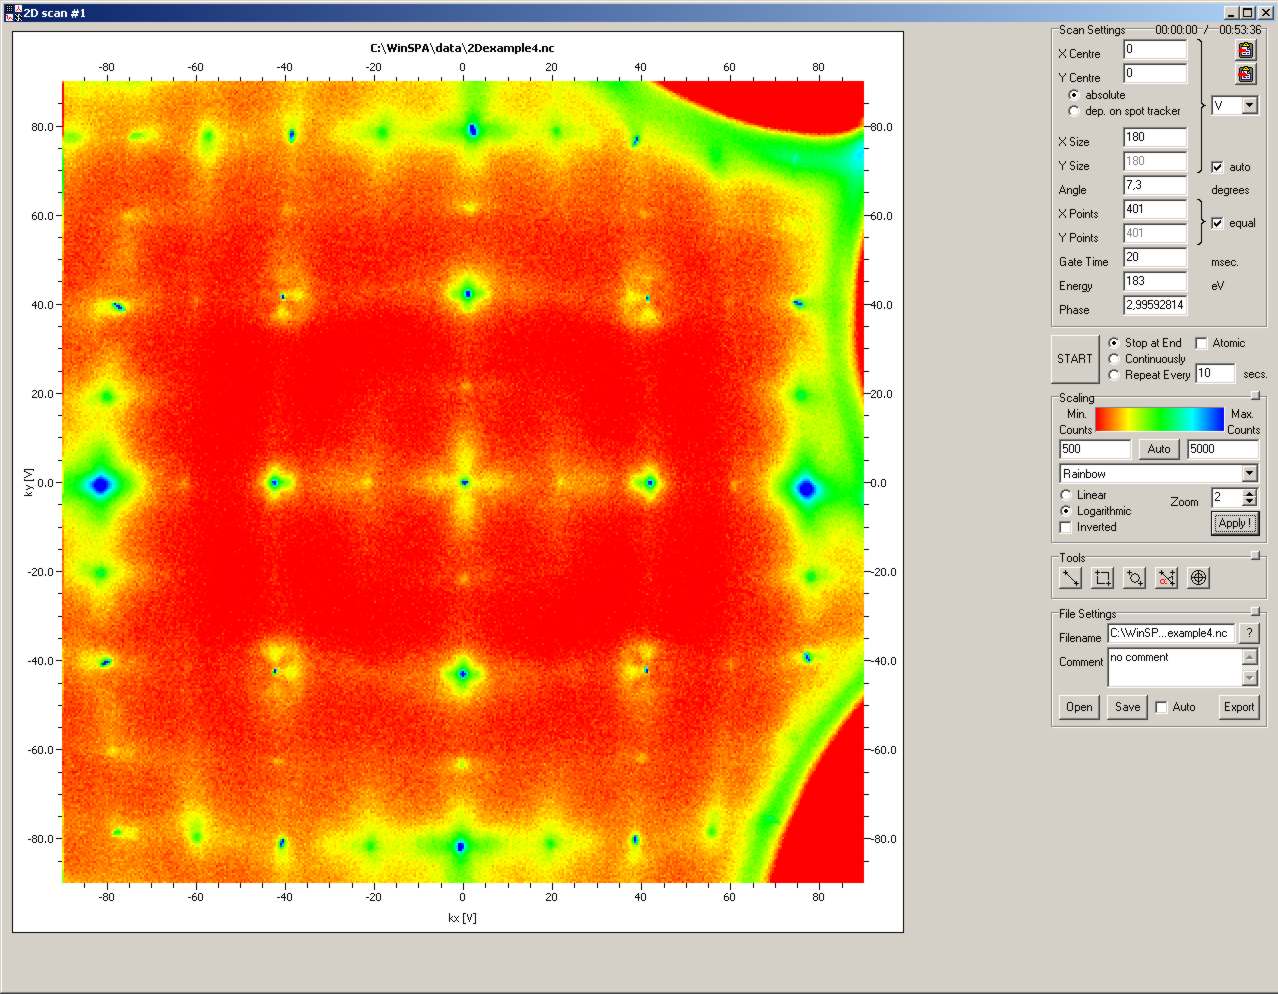
The 2D scan mode is the most intuitive one for new SPA-LEED users for two reasons:
First, it shows an
in-plane (k||) section of the reciprocal space similar to
an optical LEED system (the differences in the Ewald construction of a SPA-LEED versus
an optical LEED system are explained briefly in the hardware section of this help)
and therefore the appearance of the data is somehow familiar.
Second, the scanning itself appears to the user quite similar to that of
a scanning electron microscope (SEM), scanning tunneling microscope (STM)
or atomic force microscope. Consequently, this scan mode is ideally suited
for every SPA-LEED beginner. High resolution false colour images of SPA-LEED 2D scans
are very impressive.
It should be noted, however, that for a simple determination of periodicities on the
preset sample surface an optical LEED has two major advantages: It is faster due to
the parallel detection of the scattered electrons and the reciprocal space is
"flat" on larger scales. The major advantage of SPA-LEED to measure a highly resolved
intensity profile of a diffraction spot remains largely unused in usual 2D scans.
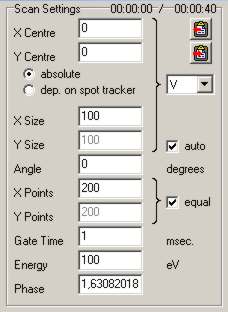
In the 2D Scan Settings group box you can enter the parameters how to execute the 2D scan.

| GUI element | Meaning and Usage |
|---|---|
| X Centre, Y Centre | (kx,ky)-coordinates of the centre of the scan area |
| absolute / dep.(ending) on spot tracker | Set whether the coordinates are given relative to the spot tracker or as absolute values. |
| X Size, Y Size | kx and ky size of the 2D scan. |
| (Y size) auto | Set this switch to define the ky size according to kx size and the number of points in kx,ky-direction. |
| K space units | Reciprocal space units for all kx,ky-coordinates. |
| Angle | Angle of anti-clockwise rotation of the scan around its center. |
| X Points, Y Points | Number of pixels in kx/ky-direction. |
| (X Points) equal (Y Points) | Set this switch to force both directions to be scanned with the same number of points. |
| Gate Time | Counter gate time in milliseconds. Typical values are between 0.5 ms and 20 ms. |
| Energy | Energy of the electrons (additional D/A converter board required). |
| Phase | Scattering phase, derived from electron energy and surface step height (see "software settings"). |
The data analysis tools help you to select 0D, 1D or 2D scan areas, copy and paste the scan coordinates to other windows etc.. In short, they help you to navigate through the reciprocal space.

| Tool name | Usage |
|---|---|
| Line tool | Draw a line inside a 2D scan. A pseudo-line scan I(k) (calculated from the 2D data) is then shown. You can set this line as a 1D scan. |
| Rec tool | Draw a rectangle inside a 2D scan. You can set this as the new scan area. |
| Ellipse tool | Draw an ellipse inside a 2D scan. The center of intensity is displayed. This is helpful for calculating spot positions. |
| Angle tool | Determine the angle defined by three diffraction spots. |
| Crosshair tool | Determine the intensity value of a single pixel. This can be used to precisely determine
a spot position even in an out-of-phase condition. As a help, the local gradient and curvature will be shown. |
[ scan settings | scan action | tools | scaling | file | context menu ]
The one-dimensional scan (1D scan) is a scan where intensity data (counts) are recorded along a line in the k|| plane. With 1D scans, lateral structures of the surface can be analyzed via quantitative diffraction spot analysis via fitting of the measured curves with theoretical peak shape such as Gaussian or Lorentzian functions. In other words: The 1D scan is the scan type that gave SPA-LEED its name.
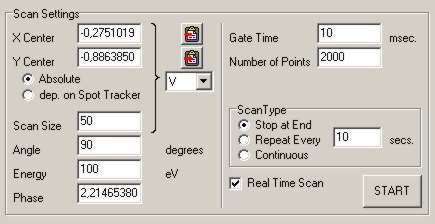
The 1D Scan Settings group box contains all parameters describing the orientation, energy, gate time and so forth of the 1D scan to be executed.

| GUI element | Meaning and Usage |
|---|---|
| X Centre, Y Centre | (x,y) coordinates of the centre of the scan line |
| Absolute / dep.(ending) on Spot Tracker | Set whether the coordinates are given relative to the spot tracker or as absolute values. |
| Scan Size | Length of the 1D scan. |
| K space units | Reciprocal space units for all kx,ky-coordinates (centre and length). |
| Angle | Angle of anti-clockwise rotation of the scan around its centre in the kx,ky-plane. |
| Energy | Energy of the electrons (additional D/A converter board required). |
| Phase | Scattering phase, derived from electron energy and surface step height (see "software settings"). |
| Gate Time | Counter gate time in milliseconds. Typical values are between 0.5 ms and 20 ms. |
| Number of Points | Number of pixels of line scan. |
| Scan type | see scan action |
| Real time scan | Select whether scan is executed as number of point scans with direct update of display after each scanned point (real time scan), or as a 1D scan with a display of the whole data after the complete scan is finished. |
With the 1D data analysis Tools you can quickly get a quantitative impression of peak height, width and background intensity of the peaks in your 1D scan.

| Tool name | Usage |
|---|---|
| Peak tool | Measure the peak height relative to the background intensity. |
| FWHM tool | Measure the full width at half maximum of diffraction spots. |
| Integral tool | Measure the integral intensity of a diffraction spot. |
| Background tool | Measure the diffuse background intensity. |
| Full analysis tool | Measure all of the above mentioned quantities at once. Should only be used for well-defined, sharp and separated spots. |
[ scan settings | scan action | other spots | scaling | file | context menu ]
The spot tracker (in Spa4.1d known as "beam finder") is a scan mode where a tracking algorithm keeps a reference diffraction spot centered and measures the intensities of other spots in parallel. It is meant for
The Spot Tracker scan settings group box contains the parameters that describe a spot tracker scan.
![]()
| GUI Element | Meaning and Usage |
|---|---|
| Spot Name | The name of the diffraction spot to be tracked. This is for you reference only. Short comments like "(00) spot" or "first half order spot" can be helpful during later data analysis. |
| Energy | Energy of the electrons (additional D/A converter board required). |
| X Position, Y Position | (kx,ky)-coordinates of the tracked reference spot. |
| FWHM | Full width at half maximum of the observed spot. This information is important for the determination of the grid size or step size
for the search for the centre of intensity. Note: You can get this value easily from the Opti Scan. |
| Max.(imum) Jump (distance) | What is the maximum drift distance between two spot tracker scans. Hard to guess for you, correct? Try values between 1 and 4 times the FWHM of the reference spot, a good value is 2 times the FWHM. |
| Threshold for Pointscan (yes/no) | Should the tracking be stopped below a certain intensity threshold? |
| Threshold value for Pointscan | Intensity of reference spot, below which the tracking is stopped and the intensity measurement remains at the same position. |
| Algorithm | Which algorithm for centre of intensity determination should be used? (see table below for details). |
| Gate Time | Counter gate time in milliseconds. Typical values are higher than for 1D or 2D scans and should be between 1 ms and 10 ms. |
Note: The purpose of the point scan is to avoid senseless tracking in a growth experiment, where the reference spot (in an out-of-phase condition) may vanish after each 0.5(1+2n)-th grown layer. As soon as the diffraction spot reappears close enough to the last known position, the spot tracker will get it again.
There are several algorithms available for the determination of the centre of intensity of the reference spot of the
spot tracker. They all try to find a compromise between speed and accuracy of this process.
The FWHM of the reference spot determines the grid or step size for the algorithms, the maximum jump distance
determines the search area. The scan time for the spot tracking will in most cases be proportional to
(Max jump/FWHM)2.
In most cases the 2x1D algorithm will do a decent job, but depending on achievable count rates and spot motion due to external
fields (sample heating etc.) you'll probably have to try out whether another algorithm may yield
better results.
| Name of Algorithm | Description |
|---|---|
| Amoeba | Steepest ascend maximum search. |
| Centre of mass, 2D | 2D scan with CoM calculation. |
| Centre of mass, 2x1D | Two 1D scans with CoM calculation. |
| Centre of mass, crosshair | As 2x1D with additional circle scan data. |
The spot tracker allows you to record the intensity of other diffraction spots relative to the reference spot. They can be defined in the table "Other Spots". If you measure their reciprocal space coordinates with the Opti Scan or with one of the graphic tools such as the Ellipse Tool in the 2D Scan then you can paste the (kx,ky)-coordinates in one of the five rows of the "Other Spots" table with the "Paste Into" button at the bottom; select the row index you wish to paste the coordinates into.
![]()
[ scan settings | scan action | tools | scaling | file | context menu ]
A reciprocal space map (RSM) is a section through the reciprocal space in the k||-kz direction. It consists of 1D line scans at different energies which are staggered according to the respective scattering phase associated with the electron energies of the line scans. If the sample is correctly adjusted relative to the SPA-LEED (for iterative adjustment procedure refer to the publication of F. Meyer zu Heringdorf in the "References" section) then an RSM shows the orientation of lattice rods and facet rods as well as their I(V) behavior (caused by the LEED structure factor).WinSPA makes the acquisition of RSMs a lot easier due to the use of "native" reciprocal space coordinates. If the sample type is correctly set and the sensitivity factors of your SPA-LEED system are correctly determined (both in the "software settings" window) then you can use the RSM scan almost as easy as any other SPA-LEED scan type. In the kz-direction the line scans will be equidistantly distributed in phase (not energy).

| GUI element | Meaning and Usage |
|---|---|
| X Centre, Y Centre | (kx,ky) coordinates of the center of each line scan. |
| XY size | Length of each 1D scan. |
| K space units | Reciprocal space units for all kx,ky coordinates (center and length). |
| Angle | Angle of anti-clockwise rotation of the scan around its center in the kx-ky-plane. |
| XY Points | Number of pixels of each line scan. |
| Z Points | Number of scan in the kz-direction. |
| Gate time | Gate time of the electron counter in milliseconds. Typical values are between 0.5 ms and 20 ms. |
| Z start Position | Start value of RSM in kz direction. |
| Z stop Position | Stop value of RSM in kz direction. |
| Z Units | Reciprocal space units for kz coordinates. |
...
Even though maybe not apparent on the first look, WinSPA allows you to easily combine basic scan types to create complex in-situ measurements of deposition and growth processes on surfaces. It should be noted that the in-situ capabilities of the SPA-LEED can only be used, if either a third-generation SPA-LEED with a conical-shaped front or an "external" electron gun in a RHEED-like geometry is used since the earlier SPA-LEED design with a flat front prevents deposition on the sample when it is positioned for a diffraction measurement.
While the Spa4.1d software provided a "macro" section for the combination of different scans, WinSPA allows you to solve many measurement problems very quickly with only a few settings in each scan window. The settings that are used for scan combinations are:
Please refer to the respective sections for further explanation of these settings.
In the following, some examples will be given on how to use these settings for an efficient combination of different scan modes during a real-time experiment such as a growth or deposition experiment. In all examples it will be assumed that you have already made a 2D scan as an overview.
You will surely find out many more-or-less-similar measurement applications during your work with SPA-LEED. Please take the examples explained above as suggestions and inspirations.